D3.js
Overview
- ニューヨークタイムズも注目!「データ×デザイン」を実現するJavascriptライブラリ「d3.js」
- データを分かりやすくスタイリッシュに可視化できるJavascriptライブラリ「D3.js」 - GIGAZINE
D3.js Wrapper Library
- Plotly
- Plotly is the modern platform for agile business intelligence and data science. - https://github.com/plotly
- dc.js
- Dimensional Charting Javascript Library - https://github.com/dc-js/dc.js
- C3.js
- D3-based reusable chart library - https://github.com/c3js/c3
- NVD3
- A reusable charting library written in d3.js - https://github.com/novus/nvd3
- d3.compose
- Compose complex, data-driven visualizations from reusable charts and components with d3 - https://github.com/CSNW/d3.compose
- d3.chart
- d3.chart is a framework for building reusable charts with d3.js. - https://github.com/misoproject/d3.chart
- Taucharts
- flexible javascript charting library for data exploration - https://github.com/TargetProcess/tauCharts
- Rickshaw
- A JavaScript toolkit for creating interactive time-series graphs - https://github.com/shutterstock/rickshaw
- d3fc
- A collection of components that make it easy to build interactive charts with D3. - https://github.com/ScottLogic/d3fc
- Recharts
- A composable charting library built on React components
- React-D3
- A Javascript Library For Building Composable And Declarative Charts
Tools
- ColorBrewer
- Color Advice for Maps - Every ColorBrewer Scale - bl.ocks.org
articles
Other Visualization Tools
→ Visualize
Learning D3.js
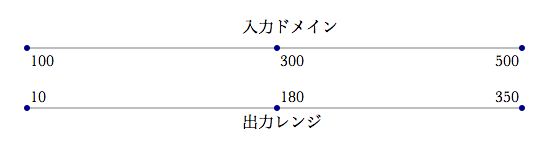
- D3 は引数の中に関数を発見すると、その関数を呼びだすと同時に、現在のデータセットの値をその引数に渡します
- 重要なことは、データが視覚化を制御しているということです。決してその逆ではありません
Reference
SVG
→ SVG (Scalable Vector Graphics)
参考リンク
- D3.js入門 (全17回) - プログラミングならドットインストール
- D3.jsで始めるData-Drivenなページ作成 | Developers.IO
- Axes — Scott Murray — alignedleft
- 軸ラベルのフォーマット xAxis.tickFormat(formatAsPercentage);
- d3.js Advent Calendar 2013 - Adventar
- 2時間縛りでd3.js挑戦してみた - mizchi's blog
- エンジニアのためのデータ可視化実践入門という本を書いた - あんちべ!
- D3.js でローソク足チャート描くなら TechanJS がイイ!(かもしんない) - 私と私の猫の他は誰でも隠し事を持っている
tech.nitoyon.com
- D3.js の Data-Driven な DOM 操作がおもしろい - てっく煮ブログ
- D3.js の d3.svg.line() を試してみた - てっく煮ブログ
- K-means 法を D3.js でビジュアライズしてみた - てっく煮ブログ
- タッチ操作に対応した画像ビューワーをJavaScriptで作るならD3.jsが便利 - てっく煮ブログ
- D3.js で自作クラスにイベント発行機能を追加する - てっく煮ブログ
GUNMA GIS GEEK
- データビジュアライゼーション(D3.js)を学ぶための教材まとめ - NAVER まとめ
- D3.js Wrapper Library - NAVER まとめ
- D3.js プラグインまとめ - NAVER まとめ
- 【D3.js】トランジション終了時にコールバックを呼ぶ | #GUNMAGISGEEK
Calendar Heat map
- Cal-HeatMap : Calendar Heat map with d3.js
- kamisama/cal-heatmap · GitHub
- 【D3.js + node.js】 ブログのデータをGithub風のカレンダーに表示する | GUNMA GIS GEEK
- Day / Hour Heatmap
レーダーチャート
Gallery
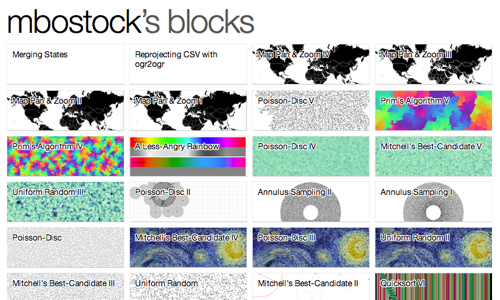
Favorite
- Les Misérables Co-occurrence
- Radial Gradient
- Every ColorBrewer Scale
- SORTING
- アルゴリズムとプログラミングをビジュアルで一挙に理解できる「VisuAlgo」 - GIGAZINE
- 郊外住宅地の見えない空き家
- Word Cloud Generator
- earth :: an animated map of global wind, weather, and ocean conditions
リアルタイム風向マップ - 【D3.js】サーマーウォーズのワールドクロックを作る | #GUNMAGISGEEK
データ
- 政府統計の総合窓口e\-Stat−API機能
政府統計の総合窓口e\-Statで提供している統計データ等を機械判読可能な形式で取得できるAPI機能を提供します - 【e-Stat】 政府統計の総合窓口 GL01010101
- 統計 API デモンストレーション - 統計表の取得
- 国勢調査など政府統計データをCSV化してダウンロードできる「統計くん」 政府API活用 - ITmedia ニュース
- 無料で利用できるデータベース&レファレンスサービスまとめ
- JR東日本:各駅の乗車人員(2012年度)
- 社会人なら知っておきたい無料の公的統計データ「e-Stat」と「統計メールニュース」 | Web担当者Forum
- 東京メトロ、列車の在線位置など全線オープンデータ化、車両の所属会社も -INTERNET Watch
- 鉄道やバスの運行情報をオープンデータ化、鉄道会社などが研究会を発足 -INTERNET Watch
- 【マーケッター必見!】市場調査や企画書作成に役立つ統計データ20選!
- 駅データ 無料ダウンロード 『駅データ.jp』 XML/JSON APIあり
- 愛知県の駅の1日の利用者数ベスト200ワースト200
- 【画像大量】俺が長年貯め込んだグラフ・一覧・比較・図解フォルダが今、火を吹く:キニ速
- 世界の労働力人口 国別ランキング・推移 - Global Note
- 日本の行政機関が公開中のAPIについてのまとめ(2016年8月17日暫定版) - Qiita
地図
- → Map
- Geo Projections · mbostock/d3 Wiki
- D3.js Geo(Geography) チュートリアル - NAVER まとめ
- JavaScript - D3.jsとOpen Data〜その1地図を描画する - Qiita
- D3.jsで地図を作る。
- 高崎市と前橋市のAED設置施設一覧に緯度経度を付加してみた | GUNMA GIS GEEK
- 【D3.js】Google Mapにsvgを使ってマスクをかける | GUNMA GIS GEEK
- ゼンリンの「いつもNAVI-API」を使って地図を表示してみた。 | GUNMA GIS GEEK
3D
TIPS
ファイル出力
- D3.jsで作成したグラフ(SVG)を画像として保存する - Tech-Sketch
SVGで作られたグラフをCanvasに変換し、PNGとして保存する - Export d3js/SVG as SVG/PDF
D3.js → SVG, PDF, PNG ダウンロード - SVG を PNG に変換するやつ (Ruby-GNOME2/RSVG on Sinatra) - X X X